Thursday, April 30, 2009

Back to the charts - So Much Support!


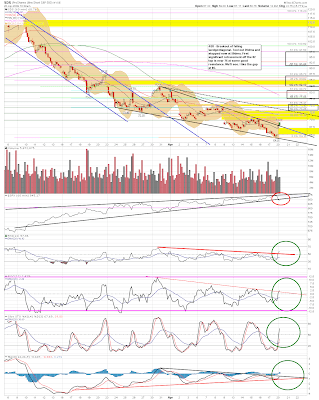
Since Danno and Kenny both think we possibly topped at 888 I thought I would go back into finding support mode. On the very nicely labeled chart you'll find annotations that lead you to two trendlines we first have to break. Then we have several ma's and a lower BB to get thru. Then there is the small gap and the retracement zone (I only ran fibs off of the 826 low - there are two more sets we need to fight thru as well). Then there are those pesky trendlines on the indicators that they have been obeying for a month now. These need to be cracked and then the uptrend will officially be over. I'll add to shorts at that point. Finally the three previous lows need to be taken out. All that just to get to 825. When we get there I'll revisit everything below that. I agree with Dan that this pullback may be swift and over of you blink. Kenny has also mentioned the phrase knife thru butter. The last serious pullback was 40 points in one day. When the bulls run for the gates they may all try to get there at the same time.

Mexicans urged to stay at home

Shutting down Mexico for 5 days. Hmmm, my naysayers about my "paranoid" rants might be eating some crow soon. Click on the link to the very short video. I find it VERY surprising that the "embed" link was disabled for this vid. Maybe they don't want it spreading around the web so fast or YouTube is in need of some revenue generation. either way I believe it is being suppressed to some degree.

Got a case in Georgia today.

Let me reiterate my thoughts on this. It is serious, but might play out like the 1916 version - light in the spring and heavy in the fall. Or not at all. Who knows.

Possible short play on Swine Flu

I was reading a story on the epicenter and the first victim of the Swine Flu. The Times of London interviewed the mother of 4-year-old Edgar Hernandez of La Gloria in Veracruz (patient zero), the location of the giant Smithfield Foods hog production facility.

"Mexico outbreak traced to 'manure lagoons' at pig farm"
http://www.timesonline.co.uk/tol/life_and_style/health/article6182789.ece

"Residents in ‘epicentre’ commute to the capital" includes the statement, " These lagoons, particularly in plants in North Carolina and Virginia, are full of not only faeces, but also chemicals, drugs injected into the pigs, blood and afterbirth, and they are actually pink in color."

Letter from Smithfield Foods to their employees -

http://news.prnewswire.com/DisplayReleaseContent.aspx?ACCT=104&STORY=/www/story/04-30-2009/0005016453&EDATE=

Here is a plethora of article on this.

The blog link is to Yahoo Finance with analyst downgrades.
http://abcnews.go.com/International/WireStory?id=7445759&page=2
http://abcnews.go.com/Business/wireStory?id=7443611
http://www.grist.org/article/2009-04-25-swine-flu-smithfield/
http://www.huffingtonpost.com/david-kirby/swine-flu-outbreak----nat_b...
http://www.bloomberg.com/apps/news?pid=20601103&sid=aw29KEb8Y8tI&refe...
http://www.google.com/hostednews/ap/article/ALeqM5h6VKpIFkn2z95MlbRey...

I just don't see anything good coming out of this (except for the better treatment of the animals and the improved conditions of our food supply). Do your own homework and make your own conclusions. This thing may just blow over and be nothing, but I don't think so.

http://finance.yahoo.com/q/ks?s=SFD Shares short - 16.6%

Wednesday, April 29, 2009

Three Swine Flu ideas

From everything I have read BAX, GSK and NVAX (and form looking at my posts I have read a bunch) are the three leading the charge for a new vaccine. Charts are in my chartbook. I may do a post later to prove this, but you can look at my post below on Novavax and see below for links to BAX and GSK's involvement in all of this. There are several stocks in my chartbook that I have ID'd as SF plays. NVAX has suspiciously not pulled back like the rest of the others. There is also some suspicious price movement in some of the stocks around the 15th before this was made public to the masses but coinciding with the initial news out of Mexico.

Here is the link to the BAX article.

http://centurean2.wordpress.com/2009/04/28/live-avian-flu-virus-placed-in-baxter-vaccine-material-sent-to-18-countries/

Baxter's screw up:

Virus mix-up by lab could have resulted in pandemic

http://timesofindia.indiatimes.com/Health--Science/Science/Virus-mix-up-by-lab-could-have-resulted-in-pandemic/articleshow/4230882.cms

About the WHO's scale

About the scales the WHO uses.

Swine Flu - Level 5

Click on blog title for link to story WHO Raises to level 5. Link to announcement.

There are 6 levels. Level 6 you don't travel anywhere.

Swine Flu on Google Maps

I'll keep throwing this to the top till it's over. seriously - look at the map in hte AM and PM and watch the cases pop up. This is not as current as I am hearing from other sources, but a good barometer.

Throwover Double Top


Hey a chart - yeah, I still do those. Let's give this a shot. If it does not work I might quit and join the GS (oops i mean green) team and hang up my red jersey for prosperity.

Diagonal ending and looks like a classic throwover E touch that is near a double top at 875. Volume is sucking, so this may be the double top low volume sucker rally top the bears have been looking for. This BS can't go on forever, or can it?

GL trading.

Ron Pauls says relax


I take this man's word over anyone's on the hill. He shoulda been our president.

Is Novavax the smoking gun behind the bio-engineered swine flu?

or is this a big hoax to sell his flu remedy? Tough call. As mentioned in my blog post below, both Reuters and the WSJ have questioned the strain of the flu and are asking the question, was it bio-engineered? Dr. Len Horowitz documents Novavax's (NVAX)relationship with the CDC and other bio-defense contractors very nicely and appears to have put all the pieces of the puzzle together. Just take a look at the vid or click in the link in the blog title to read his documented transcript. It is interesting to say the least and will make a great movie someday.

YouTube link:

http://www.youtube.com/watch?v=GBeKB7aKzOs

Tuesday, April 28, 2009

Swine Flu in the "other" or "real" news

Hre is a hodge podge of stories from bloga and the "other" press -

Mexican Reports: Flu Much Worse Than Reported
http://susiemadrak.com/2009/04/26/12/27/mexican-reports-flu-much-worse-than-reported/
And you thought we were the only ones that did not tell the truth?

FACTBOX: New flu strain is a genetic mix - FROM: Reuters
http://uk.reuters.com/article/usTopNews/idUKTRE53N4ZC20090424
Uh - Like a Bio-weapon Flu cocktail?

Swine Flu: Look Hard Enough, and You’ll See Strange Things
http://blogs.wsj.com/health/2009/04/23/swine-flu-look-hard-enough-and-youll-see-strange-things/
This is from The Wall Street Journal - That's a worthy source.

Economic Impact of Avian Flu
http://web.worldbank.org/WBSITE/EXTERNAL/COUNTRIES/EASTASIAPACIFICEXT/EXTEAPREGTOPHEANUT/0,,contentMDK:20713527%7epagePK:34004173%7epiPK:34003707%7etheSitePK:503048,00.html
From The World Bank - Not all that trustworth, so take this one lightly.

Homeland Security Declares Public Health Emergency Over Swine Flu Outbreak
http://globaleconomicanalysis.blogspot.com/2009/04/homeland-security-declares-public.html
Mish is usually light hearted - not on this one.

You know me constantly looking for catalysts for P3. Consider this one more in the bag. I'm gonna leave the conspiracy twist off of this one for now. I am taking this very seriously and think you should as well.

GL

Schwarzenneger Declares State Of Emergency Over Swine Flu

From Tyler at Zero Hedge.

I'm telling ya, this is gonna be a big deal .

Another Swine Flu Map

I like the google map in the post below better.

Monday, April 27, 2009

Volcker punctures the nonsense

A snippet- "Mr Volcker actually said, "I don't get it", which is a Big Fat Lie (BFL), because he understands it perfectly, but he is just so polite and so politic that he finds it hard to say, as I would have so succinctly put it, "How in the hell can you talk about purposely creating at least 2% inflation in prices and then talk about the Fed's duty to pursue price stability at the same freaking time, which gives rise to the expression 'talking out of both sides of your mouth at the same time', and also gives rise to an occasion for me to call you a lying halfwit economic ignoramus who thinks that everybody else is so stupid that you can say such utter preposterous crap like this to me and think I am going to swallow it!" "

Good read.

Swine flu on google maps

Click and drag the map around the world not just in US.

You need to look at this daily as you can see the spreading of the cases. there were no cases in the southeast yesterday, there are now.

Swine Flu Charts

If any of you care to see some Swine Flu stocks I added a bout 10 to my chartbbook. Make sure you click on the chartbook and then scroll down to the swine Flu section and then you can click thru them. I'll chart them when they calm down. I am not buying or shorting. I do hold out that the fear of this potential epidemic is real and worth keeping an eye on.

Click on the link above or paste this in your browser.

http://stockcharts.com/def/servlet/Favorites.CServlet?obj=ID3186525&cmd=show&disp=p

Saturday, April 25, 2009

SPX Daily Indicator Chart - Looking for Double Top


This is the second chart in my chartbook, $$ 1- SPX Daily Indicator Chart, better viewed there.

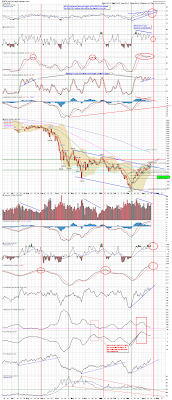
Looking at trends RSI may need to peak again, Full STO likes to peak a couple of weeks before the top (in this case it is embedded), the last time MACD and PPO knotted up at the top it lasted a couple of weeks, TRIX is about to cross, Volume is still too high IMO and SPXA50 is staying overbought. All this combined with SPX completing a 61.8% retrace off the 1007 top at 875 and the rising diagonal/wedge having ended (or possibly forming a new larger diagonal - Blue lines) is telling me the top is near. Maybe it's looking for the double top.

On the way down you can see the SPX is being supported by the 100ma. This has to crack before we can get anywhere. The retracements are plain to see. 818 to 810 is going to be a formidable support range. The gaps at 852, 826 and 768 are other important areas.

After looking at all the various rising wedges on the likes of AAPL, AMZN and others (see posts below) and the falling wedges on the bear ETFs, it is hard to believe that we have not topped or will be double topping and headed down soon. It may be a bumpy road down filled with a lot of support areas and dma's that need to be taken out (not to mention fighting the Fed, PPT and other market manipulators. For the longetst time I mentioned that it would take some sort of "external" factor to make this puppy drop and the way things are going that still might hold true.

Enjoy the weekend.

Thursday, April 23, 2009

Take the trash out

Gonna start posting a few of the better articles I read. Just to make myself feel better via sharing my pain with you all. Honestly there are so many I'm not sure how this report will develop. It is quite comical in a sick kind of way. Please click on the feedback buttons or leave a comment to let me know if this is worth the time or not.

Post 1) From Mish - Leaking and Reeking of Stress - best quote, "So now we can prepare for a "week of leaks" starting Friday, where good news lies are spoon fed to the public in a hopeless attempt by the biggest liars on the planet to gain credibility."

http://globaleconomicanalysis.blogspot.com/2009/04/leaking-and-reeking-of-stress.html

Post 2) From Zero-Hedge - Tim Geithner To Put Chrysler In Bankruptcy Next Week - best quote - "Nothing like using Chrysler with its millions of worker as leverage in negotiations with GM's bondholders. Too bad there is no Chrysler public stock that can be short squeezed to oblivion."

http://zerohedge.blogspot.com/2009/04/tim-geithner-to-put-chrysler-in.html

Post 3) From Credit Writedowns - German Press: Fiat to sign a deal with Opel, not Chrysler - best quote - "I want to make clear the significance of the Treasury’s Chapter 11 bankruptcy plan for Chrysler if Fiat pulls out. It will mean massive job losses and and a huge down-tick in consumer demand. There will be no second half recovery. Geithner and Obama will look very much like greenhorns and lose a lot of credibility."

http://www.creditwritedowns.com/2009/04/german-press-fiat-to-sign-a-deal-with-opel-not-chrysler.html

Post 4) From Mish - Fannie Freddie Delinquencies Soar (and they are going to get much worse) -best quote - "A key point for the above charts is that Fannie and Freddie loans are now blowing up at a faster rate than the entire universe of loans!' NOTE: see more awful housing information at Calculated Risk.

http://globaleconomicanalysis.blogspot.com/

Post 5) From Calculated Risk - Unemployment Claims: Continued Claims at Record - best quote - "Continued claims are now at 6.14 million - the all time record."

http://www.calculatedriskblog.com/2009/04/unemployment-claims-continued-claims-at.html

To sum it all up - (and I left credit card issues and the great earnings of American express off the hit list) - we got a bunch of people unemployed, I mean bunches (over 6 million) and the true number is not being reported to you and me by the likes of CNBS or our government. Those revised numbers seem to be getting worse every week. Well, all of these people are defaulting on their mortgages at a pace that is astounding. Chrysler is going under and will most likely take GM with it. (maybe this will be good for jobs?) Timmy says the banks are well capitalized and the stress test results will prove once and for all that our financial institutions are A OK! All this good news and the DOW was up 70 points today. I don't need to rehash how much bull shit is flying around out there. I'm really at a loss for words. Think about it this way. for years (really decades) China and Russia have lied to the world about the state of thier economies, now it is our turn.

Oh lets not forget this one - California today sued investment subsidiaries of Wells Fargo & Co. for securities fraud, alleging that the San Francisco financial services company misled investors by selling $1.5 billion worth of risky securities that it peddled as being as safe as cash.

SPX in a symmetrical triangle.


Any further short squeezing and this thing pops up. If not it pops down. Very dangerous time to be in the market either way. Looks like it plays out tomorrow or Monday. See notes from Stockcharts in the chart. This has net all qualifications to be a pennant and has a 75% chance of breakout to the upside and it is usually a continuation pattern. They do caution against trying to gauge the direction.

See notes in both posts.

That short burst down long move up on the 60m chart is killing me.

AMZN Chart


Looks like AAPL. So many patterns topping out in rising wedge formations.

Still in P1? and Not ready for a big fall just yet so says the weekly chart.


See the wave counts. Looks pretty clear cut to me. Not being a professional EWT counter (and not pretending to be one) I am not positive if there have been any violations of previous levels that would disqualify this being 4 of 1.

As for the fall. Looking at the indicators on this weekly chart SPX might have some time to go before we can get the top of 4 of P1 in (or to the top of P2). Now, I will clarify this is just a possibility and I am still in the P2 camp. Just posting it for you permabears.

The trendline on MACD is the key for me. It does not look like the first trendline will hold at all (although the dailys are turning which might cause a brief turn here). It may be headed for the second trendline above for the ultimate top of this wave. The Slow STO indicator line cross has been the most reliable trend change indicator on this chart. While it is entering the extreme zone I see no sign of a turn soon and it could embed (again the dailys are turning and might force a move that would cause a turn here but that is not expected). This will mark the next top (4.1 or 2). Either way at that top I'd be out of all longs and looking to short.

This is my third chart in my chartbook titled $$ 2 - SPX Weekly Indicator Chart

NOTE: The daily charts are ready for a good turn and have actually rolled over and given the signals for a near term fall. At this time I like the 810 level with targets as low at 768.

Wednesday, April 22, 2009

AAPL Chart


See notes in chart.

ES Daily Struggling To Close Below The Rising Wedge.


You can clearly see the channel up off of the 667 low. Then we get into the debate of a diagonal or rising channel from there. The bull argument is that the lower low just extended the diagonal and the daily is struggling to close under the trend line and until the channel breaks we're still headed up. The bear case is that the indicators are showing clear sell signals and that the diagonal is ending or has ended (choose your diagonal). Market sentiment is still short term bullish IMO. Bulls are putting up a good fight and with the banks apparently solvent (as far as we are told) and a sprinkling of good earnings the market is still levitating.

As you saw Monday the sellers are ready to leave if given a reason, and they are ready to leave in a hurry. This will be the case IMO. Any selling momentum will foster more and it could get ugly for a day or two (impulse waves down) while the correction lasts till the Stress Tests are released early May I'm guessing at this time. I'm looking at the lower channel line and then a break of the larger channel 50% line (the top diagonal red line is the 1007 to 945 top line) to mark any significant move south. These occur in the 815 support area. 768 is the 50% retrace and that is my target for this pull back at this time.

GL trading.

Tuesday, April 21, 2009

SPX Inside the 60m Chart - the good and the bad.


OK lets see the good and the bad. Of course the good is the bad in this case since I want this puppy to just puke all over its self.

The good:

1) 851 to 857 is the retracement zone off the 875 top and its at 850.
2) At this time the 50dma is at 850 sitting on the candle holding it back.
3) Resistance area above from 855 to 858.
4) SPX is falling out of a massive diagonal that has a target line (this week) around 810.
5) There are three gaps reachable and hopefully the one at 768 is what this market wants (I'll leave the ultimate gap prize out of the equation for now).
6) The retracemant zone for the whole climb off the bottom is 771 to 746.
7) The daily indicators are all overbought and at extremes.
8) SPXA50 is out of hand.
9) CPC is just a little bullish.
10) SPX set a lower low yesterday.
11 - 1011) We have a few problems with our economy.
1012) California (it is its own economy)

The bad:

1) SPX has broken back above the BB20ma and the 10ma.
1a) The 100ma is now support again.
1b) Look at the 10ma turn at the 100.
2) The 10ma is now back above the BB 20ma.
3) Timmaaaay.
4) CNBS.
5) GS and all the former (?) GS employees running the show.
6) The 60m indicators are bulish.
7) The dailys appear to be whipsawing (AGAIN).
8) The weeklys might have to top out to end this run.
9) SPX is in P2 - S135, Uner and other P1'ers might as well hang it up.
10) SEC.
11) The FED and Treasury and YOUR never ending willingness to supply them with your tax dollars to rescue the banks that are "well capitalized".
12) Creative accounting and analysts.
13) Ratings agencies.
14) Greed.
15) We may need a possible backtest of the diagonal.
16) A new larger diagonal or upwards channel may have formed with the last low.

That is enough for now. Bears, while you may be fundamentally right (WE ARE), the deck is stacked against you. Welcome to the Land of OZ where the Emerald City is being bailed out and there is nothing you can do to control the man behind the curtain. P3 will be here for our vindication and the pain will be great. I just hope we all make enough money to survive the impending doom. One more suggestion - I'd begin stashing some of your cash at home (I'll mention a weapons stash later this year in this spot cause the dollar may not be worth anything). These "well capitalized" institutions may not be able to cash your pay check this time next year.

Whitney Expects Banks to Return to 'Negative Earnings’

This is a GREAT VIDEO (if you are a bear). The "The Great White Wash" is on. One time miracles that won't last. This run up is being done for a reason. I hope we all get out with what's left when it does turn. Right now Timmaaay, GS and the Fed are pulling the wool over everyone's eyes. Be careful if you are long or short. This thing is gonna bust one day and it ain't gonna be pretty. She lays it out pretty good here.


"The founder of Meredith Whitney Advisory Group forecast Citigroup will cut at least $500 billion in credit lines and the credit-card industry will cut $2.7 trillion in credit-card lines, which could further pressure home prices as Americans have less to spend." Get you sum of that!


This link may work if clicking on the title of this blog does not work. I really don;t thnk they want you to find this one.

http://www.bloomberg.com/avp/avp.htm?clipSRC=mms://media2.bloomberg.com/cache/v04.7emHef8A.asf

If not it should be on this page. Look to the last article - It may be on page 2.

http://search.bloomberg.com/search?q=whitney&site=wnews&client=wnews&proxystylesheet=wnews&output=xml_no_dtd&ie=UTF-8&oe=UTF-8&filter=p&getfields=wnnis&sort=date%3AD%3AS%3Ad1

For another MW video on the banks (from the same interview):

http://www.bloomberg.com/avp/avp.htm?clipSRC=mms://media2.bloomberg.com/cache/v04.7emHef8A.asf


Click on the title for link to Video 1.

Possible SPX channel up or a new diagonal?


I hate the thought of it, but the gravity defying market is apparently ready to levitate some more. Timmaaayy says banks are well capitalized, so everyone put on your party hats and go buy some more. Nothing to see here, move along. Pay no attention to the man behind the curtain. If the 60m indicators follow their pattern of quick fall and long slow recovery the bears may be in for more pain. Daneric had a hyper bull scernario that he shelved yesterday - maybe that was a day too soon. I hope not.

Plaes click on the good, bad, fair buttons.

Will Leveraged ETFs Put Cracks in Market Close?

More nitty gritty behind the 3x leveraged ETF's. Want to know about those late day moves and how they might happen? Via Naked Capitalism's link to a site called Abnormal returns I found this post on The Daily Options Report that led me back to the WSJ where Saturday there was a post on Will Leveraged ETFs Put Cracks in Market Close?


"Now let's say the fund's net assets grow by $10 million during the day, to $110 million. The fund must raise its swap exposure from $200 million to $220 million to honor its 2-for-1 investment objective. That is $20 million in extra buy orders, all coming into the market after 3:30 p.m., typically in the final 10 minutes."

It is a short but interesting read. Click on the title of this post to go to the article.

Circuit-Breakers 101 (from ZeroHedge)


This may be pertinent information (or maybe not).

Monday, April 20, 2009

How much more proof do you need?


OK, I was wrong. I thought it would take a day or two to get to this point. Bottom line is we finally made it. There should be enough indicators here to convince you a strong turn is in (can you say perfect storm). I'll break out the weekly version of this chart at the end of this week to see just how sustainable this move will be. Looks pretty convincing here at least for a move to 810 and possibly beyond.

Backdoor Way Investors Can Clear Housing Inventory

Naked capitalism has so many good articles. Thought I needed to share this link as I constantly scour the net for impending P3 catalysts. Here is another.

My favorite part - "Thus, there could be a spike in foreclosure auctions later this year and well into 2010. Assuming ’09 is the peak year for tax lien auctions (i.e., there will be fewer delinquent property owners next year than this year) that might mean that the Maryland housing market – especially in high delinquency regions like Baltimore city – could begin to really bottom over the course of the next year. In other words, these lien owners could force the system to purge itself of its excesses more so than the banking system or the government will."

The link is in the title of this post.

Enjoy.

Banking index topped out and BAC


Looks like a channel to me. Pullback to the sky blue support area minimal IMO. could get worse. We'll have to see with the stress test results on May 04.

SDS Chart


Just throwing a few charts up from requests. Not too much detail. Fibs and TA only at this time.

Sunday, April 19, 2009

2 or 3 days of consolidation up here?


Stay tuned. I believe I have identified several key indicator points that will give us the turn at least on the right day if not in the right hour (I hope). This is the second chart in my chartbook and you can see it much better in Stockcharts. I am working on the weekly version of this same thing. According to this I am now of the opinion this may possibly be the end of P2 as Kenny has qualified a valid ABC pattern and notes that the move up has qualified the retracement as valid enough for P2 to possibly be over. It sure looks like the end of a cycle in all ways. If it is not the end of P2 and just (A) of 2 then (B) should be pretty strong. 770 to 750 range. We'll have to see. It would not suprise me to see this manipulated market make a shallower pull back and remain overbought. GL today.


UPDATE: The weekly chart still has room to run. Maybe this turn down will cause a reversal in the weekly, but maybe not. Weeklys look like they want to run still. Who the heck knows?

Friday, April 17, 2009

No Party at 875?

Well we'll have to just wait a little bit longer then. How bout that move in SHLD today. Up 7.75% today and 83% since March 9th! I was all over that move. Weren't you? Saw it coming a mile away. Impressive. Think the shorts are out yet? Nothing like a real estate laden, high credit driven retailer located in a bunch of bankrupt malls rallying at the top. Boy you would think that everyone is running out for a new Kenmore double stack right now (and paying cash to boot!).


Sorry, but this bull shit has to end and when it does it's gonna hurt. No positions today. I sold some longs and generated some cash. I'll post a bunch this weekend and try my best to get a handle on things. Who knows - you might get a pummelled late night pissed off classic Shanky rant. Those are fun! You know when you read you blog in the am you don't remember posting them - HA (just kidding - would not do that).


Anyway - have a great weekend. Don't forget to call your congressperson and thank them for further screwing up our world. You may also want to brush up on figuring out the old shell game and trying to follow that little ball, cause they are good at it and they know where the ball is at all times.


Shanky.

Thursday, April 16, 2009

Was it the Fib retrace off the 1007 top all along?


Of all the fibs I try to include I can't believe I left this one out. The 61.8 retracement off the 1007 top to the 667 bottom is 877. This is a good example of why I do so many charts in different time frames. You can catch stuff like this (if you get ti right the first time of course). Maybe this helps our situation. We have completed a strong 50%+ retracement off a major top. Keep your fingers crossed.

The Coolest Job Loss Chart I Have Ever Seen and Commercial RE is 'Possibly' Collapsing

This is one you just gotta see. http://www.slate.com/id/2216238/ has an interactive map of vanishing employment across the country. Push the play button and watch 5 million jobs disappear and where. It is quite fascinating. Mish has a small write up on this as well. This is a must clicker.

and

From Marketwatch: General Growth Properties files for bankruptcy - General Growth said it filed for bankruptcy protection in the United States Bankruptcy Court for the Southern District of New York. In addition, approximately 158 regional shopping centers also filed for protection.


We've been waiting for the commercial real estate shoe to drop, so why not start with the nations second largest.

http://www.marketwatch.com/news/story/story.aspx?guid=%7BEE6CE352%2D8D6C%2D4E52%2D9142%2D86608A2404AF%7D&siteid=rss

Wednesday, April 15, 2009

FAZ 60m - Not yet.

SPX Key supports lines and larger fib target


807 and 753 are the two key numbers. Not pictured is that 753 was also very near the close on 11/20 and 11/21(but not the spike low). Most support lines were drawn on a 60m chart, but I used daily for more powerful picture of how overbought all indicators are.

XLF is overdone - stick a fork in it.


Looks pretty similar to Dec/Jan IMO. Fake out sell signs to continue overbought situation. Get the short squeeze. Last few days of big up volume for the suckers to come in and BAM! This time the indicators are even more ripe and the rising wedge formation is much better. I'm looking for a fall to the 50dma and 50% retrace and will regroup there.

Tuesday, April 14, 2009

SKF pattern ending


See notes in chart.

Could AAPL be toast?


Target 102.75. Not sure about time frame but sooner than later. The intersection of the downward sloping blue line and the purple dashed for a backtest would be interesting.

P2 Playout with numbers

The BB's on the weekly VIX are 21pts apart - pretty narrow and we're trading near the bottom. Might be more power in 2 that expected or are they narrowing for the 3.1.2 move? Time will tell. Going back a few weeks when I got ahead of myself trying to figure out where P2 could take us - a full retracement is not out of the question is it? 1.1.2 was massive. 3.1.2 will be lots of fun. 3.3.2 might be a moon shot. This has me wondering if we are still possibly in P1. Thanks.

I found a nice write up on the "Fake Recovery" that as you read thru it you can't help but read the waves as it plays out. It gives really good "scenarios" regarding recovery and why (P2), but also why it won't work in the end (P3). This is a scenario that takes us up in P2 thru the 2010 elections and crumbling down in P3 after them. This is a really well done post IMO from Naked Capitalism guest poster from the site Credit Writedowns.

http://www.nakedcapitalism.com/2009/04/guest-post-fake-recovery.html

Here is a hypo playout for 1.2

Start End Length Retracements
Wave 1 667 864 197
Wave 2 864 766 99 50% Retracement
Wave 3 766 1061 296 1.5 Wave 1
Wave 4 1061 913 148 50% Retracement
Wave 5 913 1110 197

Wave 1.2 total Length: 443
% Market Gain: 0.665
Wave 2.2 Total Length: 222
Wave 2.2 Target: 889 50% Retracement

See the % market gain - there is that 666 number again.

Monday, April 13, 2009

GS chart


Light blue rising wedge or the black channel both running into the blue channel with overbought indicators should turn this puppy. Down a little AH after early earnings release. Purple dashed line is the wedge target. I'm looking at a pullback to 100 or 95 double fib area. MACD and RSI wedges should be ending. I expect RSI to pull back to lower trendline near 50 for this bottom and for MACD to get near lower trendline as well.

Bill Moyers interviews William K. Black

This will make you feel pretty sick IMO. It is a little long but you need to hear the whole thing.


"Now Black is focused on an even greater scandal, and he spares no one — not even the President he worked hard to elect, Barack Obama. But his main targets are the Wall Street barons, heirs of an earlier generation whose scandalous rip-offs of wealth back in the 1930s earned them comparison to Al Capone and the mob, and the nickname "banksters." "


My favorite exerpt -


BILL MOYERS: Yeah, and this week in New York, at this conference, you described this as more than a financial crisis. You called it a moral crisis.
WILLIAM K. BLACK: Yes.
BILL MOYERS: Why?
WILLIAM K. BLACK: Because it is a fundamental lack of integrity. But also because, if you look back at crises, an economist who is also a presidential appointee, as a regulator in the Savings and Loan industry, right here in New York, Larry White, wrote a book about the Savings and Loan crisis. And he said, you know, one of the most interesting questions is why so few people engaged in fraud? Because objectively, you could have gotten away with it. But only about ten percent of the CEOs, engaged in fraud. So, 90 percent of them were restrained by ethics and integrity. So, far more than law or by F.B.I. agents, it's our integrity that often prevents the greatest abuses. And what we had in this crisis, instead of the Savings and Loan, is the most elite institutions in America engaging or facilitating fraud.


http://www.pbs.org/moyers/journal/04032009/watch.html

Sunday, April 12, 2009

SPX Daily - A chart you gotta see.


I updated the chart above and added the vertical lines where MACD crosses and STO crosses its EMA. If you notice where we currently are the two fakeouts at the EMA on STO are clear and SPX is running out of chances to hold up. When this crosses I would expect if to be significant but nothing is guaranteed. I also took a peek at the VIX and it is not as ready to turn as the market, but getting close daily and weekly.

I added a BGZ chart for you bears out there with retracements, resistance and gaps. The blue falling wedge in the channel is interesting. When they break out it should be pretty i like the 50% retracement at gap resistance at 70 for my first target.


We have a new convergence point. I also copied the major blue channel line and moved it up. From the indicators and the intermediate channel in the 60m chart in the post below and the looks of the indicators and resistance lines here any move above the current price IMVHO only will offer a better short entry. I've been proposing a large inverted H&S pattern for the breakout from the bottom that is still forming and that is roughly a 100 point formation there if it plays out. A back test of the red falling wedge appears to be out of the question and a back test of the blue major channel appears to be the new back test target in that retracement zone (black box).

Saturday, April 11, 2009

SPX 6 month channel


Everything here points to a turn south. I'll add more posts to try and verify this later. There is a possible inverted H&S on SPX 30m but the indicators say it won't play out. I like this channel a lot.

Friday, April 10, 2009

SRS looks pretty tasty


Falling wedge and indicators bottoming out. Don't buy just yet but soon. SDS in falling wedge as well, but might not be ready quite yet. As I go thru updating my charts, I'll post more this weekend.

Thursday, April 9, 2009

VIX at gap support and bottom of dec triangle.


Indicators show still room to fall. At the gap support from Oct '08. Maybe this is what this run was all about.

Wednesday, April 8, 2009

Looks like we're headed south soon.


Just look at these indicators. They say overbought. That does not mean they can't stay that way. What I am seeing to confirm what the indicators are saying is a break in the upwards channels that I am seeing everywhere. It should be close. Still on vacation.
Almost forgot - Masters tees off today. That will be another added distraction!
GL this week.

Tuesday, April 7, 2009

The VIX decending triangle


This is clear as day to me. Folks I am on vacation and just throwing something out there, but this looks pretty significant and the pattern is ending soon. Question is which way will it break out? That will signal where we are in the count. If we are in 2.1 it goes up. If 3.1 it breaks down. There is room for a throw under fake out. I'll kook deeper into the VIX and what its got going on in the AM. Sorry for the lame post, but I'm going for another cocktail before heading out. GL today.

Sunday, April 5, 2009

CPC and the SPXA50 Kiss OF Death


The way I see it is the CPC is now just living in overbought land. What excites me is the Kiss of death the SPXA50 threw down on Friday. Just take a peek at what's happened when the SPXA50 has kissed the 400 mark. I do not know if it will hold true, but I like the trend.

This is all I got for now.


This is all I got for now. 30m SPX chart with channel up and wedge causing what I believe is a rollover top. Indicators have neg divs. Looking at the retrace zone 760 t0 741 for the pullback and the gap fill at 770 (not pictured) and the test of the P1 trend line. I don't think it goes over 850. I have not looked at K and DE's or any other stuff yet to get a broad feel for what everyone is thinking. This move will have to be 2.1.2. I just think we're completing 1. or this will be a big C leg. I will note what I really don't like as a bear. The /ES had broken the 50% trendline and tested it (you can see the chart a few posts below. It appears nothing is stopping this upwards action at this time. GL this week.

I'm at the beach this week. Answering questions from below

I'll post some this week, but not fully committed unless something breaks. Gona clear my brain and get recharged.

Responces to questions from plas weeks post are in the post.

Thursday, April 2, 2009

It was the wedge back test after all


Boy has this chart changed.


I think the gap at 770 gets filled by the end of the month.

The road block on /ES


OK look at the lower chart first. Daily chart, bigger picture and bigger channel. Simple to see that /ES is beating its head on the 50% channel line. Now look at that top 60m chart and keep the 50% line in mind. Some of you liked the idea that I had last week about a back test of the rising wedge we fell out of. Well now that there is a channel there. How about a back test of that? I know Daneric has made a similar (and better presented and more polished post on this), but I'm trying to hit a slightly different angle. The back test of the blue channel today would be near 850. The 50% line is near 834. 836ish is a 61.8% retracement from the top at 944. The daily 100sma is at 829. Indicators on both 60m and daily are getting up there. I could draw a pretty good resistance line at 838. The retracement zone sits right on the 25% channel line below. To sum it up I'm seeing a buy the news, sell the rumor pop today. On the other hand an impulse 3.1 should have the power to blow thru all of this resistance. I'm going with the overbought indicators running into lots of resistance at interesting conjunction points and looking for the pullback to at or near the 25% channel line (if it can get thru the black line).
GL today.


Wednesday, April 1, 2009

SDS and EEV and the market


OK, so we may be in B up now and could possibly run up to 828 or above. I thought I would look at SDS and EEV for some clues as to when to ADD to positions. I mentioned on ST today late the possibility of the run up to 828 and the fact that we had some more downside possible in the likes of SDS and BGZ. So I took a peek at a couple (actually all of them). Notes are on the charts, but EEV looks tasty with indicators clearly oversold and at the bottom on the E touch of a massive falling wedge. EEV is simple enough. SDS on the other hand looks more dangerous with that gap below, but A) SDS has had a clear breakout of a falling channel and B) there is a trend line SDS perfectly tested with the low on the 26th (lower black dashed line) that runs back thru lows on May and Sept of 08 and Jan 06 of this year. Well HELLO what have we found here but the bear market bottom line and we just tested it? Y'all know Im a bear. I like what I have found in the ending wedge on EEV and just having touched the bear market bottom line on SDS with the channel breakout and 2.1.C.2 almost upon us I may get my last final bear wish out of this market sooner than later. This may be the last chance to play this bounce till P3 brings us back. I'm not buying yet as futures are at the 823 level at this tiem, but I am in the store shopping, just have not checked out yet. Note: Shorting here is EXTREMELY dangerous. If we are in P2 this is a mini bull market (ROFLMAO)and you're shorting into it. That ain't so smart. Be very careful. I am salivating for 3.1.2 to take us up and make a bunch of $$. Might be best to wait for that move. Shorting here is for the brave (or insane) only. GL.
Hey - aren't you proud of me? I did not mention the shell game, conspiracy theory or rigged market once in this post!

Taleb Says Geithner Bank Plan Is Too Limited, Will Fail from Bloomberg

Taleb Says Geithner Bank Plan Is Too Limited, Will Fail

http://www.bloomberg.com/avp/avp.htm?N=video&T=Taleb%20Says%20Geithner%20Bank%20Plan%20Is%20Too%20Limited%2C%20Will%20Fail%20&clipSRC=mms://media2.bloomberg.com/cache/v1p0xhiQAGB8.asf

He's been right all along, why would he be wrong now? And the market is on a tear. Go figure.

Added target line for 2.1.B.2


See red dashed line. If this wedge holds to form this is there I think B of 2 of 1 of 2 tops out before C down to 740 to 731.

So far so good

I almost nailed the D touch. It went slightly higher than anticipated. but it appears the wedge is in tact (for now). 50dma held SPX and possibly caused the reversal. BB's still too wide for any major move either way. 785 should be pretty good support with trendline, the 100dma, a support line and the gap all there. If it gets thru that 766 will be the next target.

GL today.